Internet of Things and smart buildings are all the rage nowadays. While these systems can improve comfort and efficiency, many of these smart systems were built with very little regard to privacy. We are developing an anomaly detection system in time series building IoT data. Also, we identified its privacy threats and propose ways we can mitigate those threats.
Background and motivation#
Internet of Things (IoT) are becoming increasingly popular as part of building automation system. Most IoT devices currently on the market have limited processing power in order to reduce their cost and power consumption. This usually results in IoT devices offloading their required data processing to the cloud. However, this raises serious privacy concerns as private and sensitive information may be transmitted to the cloud, which has the potential to be leaked or misused.
Research questions#
- What privacy threats are present in IoT-oriented commercial buildings?
- How can we reveal activity patterns, anomalous behaviours and other sensitive information from time series data collected by IoT sensors in commercial buildings?
- What is an appropriate framework to minimise revealing sensitive information in time series IoT data without impacting its functionalities?
Research methodology#
- We conducted a review of the literature on commercial IoT privacy, and developed a threat model (RQ1)
- We’re developing an anomaly detection system for time series building IoT data (RQ2)
- The idea is that anomalous or unusual readings from IoT sensors may present privacy risks, and thus needs be removed before being sent to the cloud
- We’re also proposing a framework to mitigate privacy threats in commercial IoT systems (RQ3)
Related work#
There have been some research in the past regarding anomaly detection and activity recognition in time series IoT data:
- ( Citation: Ukil, Bandyopadhyay & al., 2015 Ukil, A., Bandyopadhyay, S. & Pal, A. (2015). Privacy for IoT: Involuntary privacy enablement for smart energy systems. IEEE. https://doi.org/10.1109/ICC.2015.7248377 ) developed an anomaly detection and privacy preservation for smart meters, which involves assigning a privacy score to determine the amount of obfuscation required to preserve privacy
- ( Citation: Morgner, Müller & al., 2017 Morgner, P., Müller, C., Ring, M., Eskofier, B., Riess, C., Armknecht, F. & Benenson, Z. (2017). Privacy Implications of Room Climate Data. InFoley, S., Gollmann, D. & Snekkenes, E. (Eds.), Computer Security – ESORICS 2017. (pp. 324–343).Springer International Publishing. Retrieved from https://link.springer.com/10.1007/978-3-319-66399-9_18 ) demonstrated that even with only basic sensors such as temperature and humidity, occupancy can be detected with high accuracy
In addition, there are several papers comparing the various anomaly detection methods for time series data, such as ( Citation: Schmidl, Wenig & al., 2022 Schmidl, S., Wenig, P. & Papenbrock, T. (2022). Anomaly detection in time series: a comprehensive evaluation. Proceedings of the VLDB Endowment, 15(9). 1779–1797. https://doi.org/10.14778/3538598.3538602 ) and ( Citation: Han, Hu & al., 2022 Han, S., Hu, X., Huang, H., Jiang, M. & Zhao, Y. (2022). ADBench: Anomaly Detection Benchmark. https://doi.org/10.48550/ARXIV.2206.09426 ) , the latter of which focuses on unsupervised methods for anomaly detection.
Threat model#
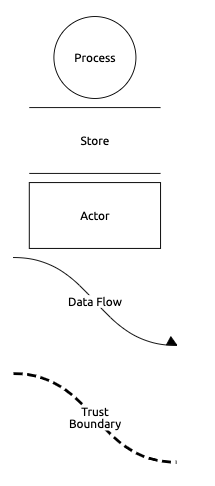
This section defined a threat model for a typical commercial cloud-based smart building system. This system comprises an IoT sensor, which records the raw observation values. These values are then sent to a gateway device, which is responsible for uploading it to the cloud. The gateway merely acts to connect the lo power sensors to the internet, with little to no processing taking place on the gateway. The cloud is responsible for storing ontology and sensor observations for the system, as well as performing the computations necessary for the system, such as HVAC scheduling. The following data flow diagram (DFD) shows the flow of data:
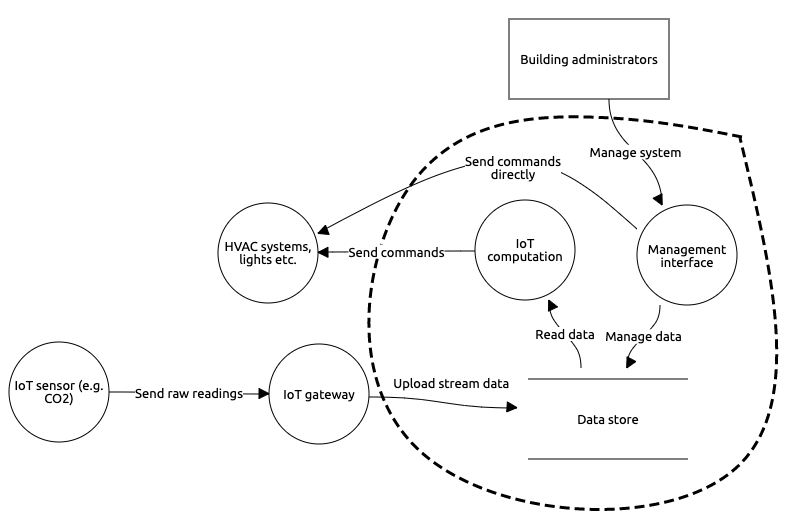
In the above DFD, elements in the circle are part of the cloud, and are thus considered untrusted. This assumption is based on the model of local differential privacy, where the data curator (i.e. the cloud) is considered untrusted ( Citation: Husnoo, Anwar & al., 2021 Husnoo, M., Anwar, A., Chakrabortty, R., Doss, R. & Ryan, M. (2021). Differential Privacy for IoT-Enabled Critical Infrastructure: A Comprehensive Survey. IEEE Access, 9. 153276–153304. https://doi.org/10.1109/ACCESS.2021.3124309 ) . This assumption plays a key role in designing our privacy preservation framework below.
Threat actors#
- Building administrators usually have the highest privileges in the system, with full access and control to the data and configuration of the system, including the raw sensor values. In this context, ‘building administrators’ can also be the owner of the building, which may be common in home or small business systems which may not have a separate building administrator. As these users have access to all aspects of the system, there is a large potential for abuse as well as risks for an extensive data breach or leakage.
- Cloud providers usually have control over the infrastructure on the cloud. This may include the server where stream data is uploaded into and processes, as well as storage servers where stream and ontology data are stored. The cloud infrastructure may be breached, which may leak the stored data. In addition, the cloud provider may be abusing the stored data for their own purposes, such as selling it to advertisers.
- IoT vendors are of similar concern with the cloud provider, where they may abuse the stored data for their own benefit.
- Building intruders and attackers may be interested in figuring out when a building is empty, or view the ontology data to determine where security cameras and motion sensors are located, which may enable them to break into the building without detection.
Threats identified#
In the following table, we identified potential threats from each aspect of the system. In addition, we try to categorise each threat according to the STRIDE model. STRIDE stands for Spoofing, Tampering, Repudiation, Information Disclosure, Denial of Service, and Escalation of Privilege. Note that this is not exhaustive, and focuses on threats that primarily impact privacy.
| Element | Abuse case | S | T | R | I | D | E |
|---|---|---|---|---|---|---|---|
| Ontology data of sensors, equipment and buildings | Data may be used to gain knowledge about the site, and find weak points to break into the site | - | - | - | ✅ | - | ✅ |
| Raw stream data | Adversaries can use the stream data to infer occupancy and activities in the building | - | - | - | ✅ | - | - |
| Data storage in cloud | Data may be leaked if cloud service gets breached, cloud provider may use data for its own use, or sell it to third parties | - | - | - | ✅ | - | - |
| Sending stream data to the cloud | Eavesdropping and MITM attacks | ✅ | ✅ | ✅ | ✅ | - | - |
Dataset and sensor selection#
Our data source for the model primarily comes from Data Clearing House (DCH), which contains ontology information about sites, buildings, sensors and equipment of various CSIRO sites according to BrickSchema. Raw sensor observation data are retrieved from Senaps. The observations do not have any labels on which data points are anomalous, and thus our model is completely unsupervised.
To better gain insights for sensor selection, we analysed observations of CO2, temperature and motion sensors during weekdays, discarding outliers and zero or NaN values. These sensor types are chosen based on its ability to detect or infer occupancy, such as in ( Citation: Worner, Bomhard & al., 2014 Worner, D., Bomhard, T., Roschlin, M. & Wortmann, F. (2014). Look twice: Uncover hidden information in room climate sensor data. IEEE. https://doi.org/10.1109/IOT.2014.7030110 ) . Motion sensors are included as they directly detect occupancy for a given area, and thus can be used to indicate whether other sensor types are reliable indicators of occupancy. However, since each motion sensor can only detect occupancy as a binary state (occupied/not occupied), we used the proportion of sensors detecting motion to the total number of sensors to estimate occupancy. We then averaged the values for each sensor every hour for the given season and plotted the results, as shown below.
From the plots above, we selected CO2 and motion sensors for our anomaly detection model, as the values are closely related to each other, reflecting occupancy of a typical weekday. Temperature measurements are excluded as it shows too much seasonal variability, and may also be affected by factors such as HVAC operation schedule, which may mask effects of occupancy.
The training set is restricted to observations from April to December 2022. This is chosen based on availability of the data as well as to avoid biases from COVID-19 pandemic.
Model#
For the purposes of our system, we define two anomaly types:
- Short term anomalies are data points that deviate from their neighbouring values. Example of this are spikes that occur by people occupying an office outside office hours for a day.
- Long term anomalies are data points that deviate from ’normal’ data for an extended period of time. Examples include a low CO2 reading for the entire day during pandemic lockdowns.
We selected the following detection algorithms for each anomaly type:
- Short term: Local Outlier Factor (LOF)
- Long term: k-Nearest Neighbours (KNN)
The algorithms are selected based on its performance for the given anomaly type, according to ADBench anomaly detection benchmark ( Citation: Han, Hu & al., 2022 Han, S., Hu, X., Huang, H., Jiang, M. & Zhao, Y. (2022). ADBench: Anomaly Detection Benchmark. https://doi.org/10.48550/ARXIV.2206.09426 ) , and availability of a mature implementation of said algorithms. Separate algorithms are used as there is no one algorithm (or parameters within an algorithm) that performs the best on all types of anomalies ( Citation: Han, Hu & al., 2022 Han, S., Hu, X., Huang, H., Jiang, M. & Zhao, Y. (2022). ADBench: Anomaly Detection Benchmark. https://doi.org/10.48550/ARXIV.2206.09426 ) ( Citation: Schmidl, Wenig & al., 2022 Schmidl, S., Wenig, P. & Papenbrock, T. (2022). Anomaly detection in time series: a comprehensive evaluation. Proceedings of the VLDB Endowment, 15(9). 1779–1797. https://doi.org/10.14778/3538598.3538602 ) .
Actual model training and testing is performed using PyOD, an open source Python anomaly detection library ( Citation: Zhao, Nasrullah & al., 2019 Zhao, Y., Nasrullah, Z. & Li, Z. (2019). PyOD: A Python Toolbox for Scalable Outlier Detection. Journal of Machine Learning Research, 20(96). 1–7. Retrieved from http://jmlr.org/papers/v20/19-011.html ) . PyOD contains implementations of many anomaly detection algorithms, with a consistent and easy-to-use API. For all algorithms in all models, the default PyOD parameters were used.
For this project, each node has its own model, trained on sensors associated to that node. ‘Node’ here means an area or equipment with sensors, such as an AHU, room or power meter.
Results#
This section presents training results for an air handling unit which contains one CO2 sensor, and methodologies to test the model against new data. The plots can be seen at the plots page.
Daily data of September 2020 to 2022#
For each day for September 2020 and 2021, we run anomaly prediction for that day and collected the results. We then grouped the days first by day of the week, and then by year, and plotted the results against the training results for the same day in 2022. This will test the model’s ability to detect anomalies when given a daily data.
Christmas 2020 to 2022#
We ran observations from 25 to 31st of October December 2020 and 2021 and compared it with the training set from the same time period in 2022. This tests the model to detect anomalies during a holiday period, with October data used as comparison for non-holiday period.
Discussion#
Observed trends on CO2 levels#
In general, there is a lack of significant rises in CO2 levels during office hours of weekdays of 2020 and 2021, with a notable exception to 29 September 2020. This confirms with the heatmap on the sensor selection section, where we see similar lack of rise particularly in spring 2021. This can be largely attributed by the COVID-19 lockdowns during that time period, causing workers to work from home and thus decreasing building occupancy. Interestingly, there is an inconsistent rise in 2022, where we expect a significant rise every weekday during office hours. This may suggest a shift towards permanent work from home, even after the pandemic ( Citation: Barrero, Bloom & al., 2021 Barrero, J., Bloom, N. & Davis, S. (2021). Why Working from Home Will Stick (w28731). National Bureau of Economic Research : Cambridge, MA. Retrieved from http://www.nber.org/papers/w28731.pdf ) . For weekends, there are no significant rises throughout the day for all days, reflecting a lack of occupancy during weekends.
Model performance#
The short term detectors were able to detect short term anomalies reasonably well, considering its lack of tuning. For example, it was able to detect a sudden spike at 3pm on 30 September 2020 as a short term anomaly. The long term detectors also work reasonably well, though not in the way we expected. As we alluded before, the shift towards work from home in the post-pandemic era causes offices to be occupied less, even during business hours on weekdays. This causes rises during such time periods to be flagged as long term anomalies. If we had trained the set on pre-pandemic data where remote work is not as common, such rises may not be flagged as anomalous. However, we do not have observations before mid-2020, hence why we trained the set on 2022 data.
Another interesting observation is that both short and long term detectors were able to flag unusually high or low CO2 levels for the entire day, such as 31 December 2022. This is an example of when an anomaly is both deviant from both its local neighbours and long term normal values.
A privacy-preserving IoT architecture#
In this section, we propose a privacy preservation framework for cloud-based smart building systems which minimise disclosing sensitive data to the cloud. Our system is based on similar systems proposed by ( Citation: Xu, Ren & al., 2018 Xu, C., Ren, J., Zhang, D. & Zhang, Y. (2018). Distilling at the Edge: A Local Differential Privacy Obfuscation Framework for IoT Data Analytics. IEEE Communications Magazine, 56(8). 20–25. https://doi.org/10.1109/MCOM.2018.1701080 ) and ( Citation: Tawalbeh, Muheidat & al., 2020 Tawalbeh, L., Muheidat, F., Tawalbeh, M. & Quwaider, M. (2020). IoT Privacy and Security: Challenges and Solutions. Applied Sciences, 10(12). 4102. https://doi.org/10.3390/app10124102 ) . The diagram below shows a high-level architecture of the system:
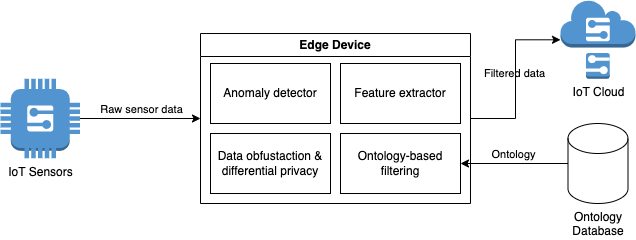
In this system, the IoT sensors can remain a low powered device, where its only job is to collect the raw data with little to no preprocessing. Between the sensors and the cloud, we added an edge node, whose primary job is to filter out sensitive data by applying anomaly detection and privacy preservation techniques before sending the data to the cloud. The edge node also takes the role of the gateway from the DFD, which connects the sensors to the outside world. Once the data arrives at the cloud, it can perform the rest of data processing, leveraging its vast computing resources. This allows the edge node to simply be made up of a cheap, low powered computer such as Raspberry Pi.
Aside from anomaly detection, the exact methods to achieve privacy preservation on the edge device remains undefined. Some suggestions for methods:
- Differential privacy is a commonly proposed method for data minimisation and obfuscation. It is the primary method employed by ( Citation: Xu, Ren & al., 2018 Xu, C., Ren, J., Zhang, D. & Zhang, Y. (2018). Distilling at the Edge: A Local Differential Privacy Obfuscation Framework for IoT Data Analytics. IEEE Communications Magazine, 56(8). 20–25. https://doi.org/10.1109/MCOM.2018.1701080 ) for their edge-based privacy preservation framework. Differential privacy commonly involves perturbation using noise addition methods such as Laplace mechanism ( Citation: Husnoo, Anwar & al., 2021 Husnoo, M., Anwar, A., Chakrabortty, R., Doss, R. & Ryan, M. (2021). Differential Privacy for IoT-Enabled Critical Infrastructure: A Comprehensive Survey. IEEE Access, 9. 153276–153304. https://doi.org/10.1109/ACCESS.2021.3124309 ) ( Citation: Chen, Machanavajjhala & al., 2017 Chen, Y., Machanavajjhala, A., Hay, M. & Miklau, G. (2017). PeGaSus: Data-Adaptive Differentially Private Stream Processing. ACM. https://doi.org/10.1145/3133956.3134102 ) ( Citation: Wang, Ren & al., 2019 Wang, D., Ren, J., Xu, C., Liu, J., Wang, Z., Zhang, Y. & Shen, X. (2019). PrivStream: Enabling Privacy-Preserving Inferences on IoT Data Stream at the Edge. IEEE. https://doi.org/10.1109/HPCC/SmartCity/DSS.2019.00180 ) and reconstruct the features into an obfuscated data stream. Differential privacy makes it more difficult for attackers to extract anomalous or unusual activities from observation values.
- Ontology-based filtering uses machine-readable description of each element in the IoT system, including how the data is collected and used ( Citation: Markovic, Asif & al., 2018 Markovic, M., Asif, W., Corsar, D., Jacobs, N., Edwards, P., Rajarajan, M. & Cottrill, C. (2018). Towards automated privacy risk assessments in IoT systems. ACM. https://doi.org/10.1145/3286719.3286723 ) ( Citation: Bali, Al-Osta & al., 2017 Bali, A., Al-Osta, M. & Abdelouahed, G. (2017). An Ontology-Based Approach for IoT Data Processing Using Semantic Rules. InCsöndes, T., Kovács, G. & Réthy, G. (Eds.), SDL 2017: Model-Driven Engineering for Future Internet. (pp. 61–79).Springer International Publishing. Retrieved from http://link.springer.com/10.1007/978-3-319-68015-6_5 ) . For our dataset, we can expand DCH to include this extra information for privacy preservation. These data can be used to perform tailored privacy preservation, depending on the requirements of sensors, rooms and the user.
Future work#
While our anomaly detection system has a great potential for IoT privacy preservation, it still requires continuous research efforts and improvements to make it ready for real-world use. This section summarises some future directions to explore.
Tuning of detector parameters#
It is clear that the default parameters used by PyOD gives unsatisfactory results for our purposes. Extensive experimentation is required to determine the best algorithms and parameters for the given model. While there are some efforts to automate this process such as MetaOD ( Citation: Zhao, Rossi & al., 2020 Zhao, Y., Rossi, R. & Akoglu, L. (2020). Automating Outlier Detection via Meta-Learning. https://doi.org/10.48550/ARXIV.2009.10606 ) , there is still much research needed on automated algorithm selection, configuration and tuning ( Citation: Schmidl, Wenig & al., 2022 Schmidl, S., Wenig, P. & Papenbrock, T. (2022). Anomaly detection in time series: a comprehensive evaluation. Proceedings of the VLDB Endowment, 15(9). 1779–1797. https://doi.org/10.14778/3538598.3538602 ) .
Development of generalised model#
In our current iteration, each node has its own model, trained independently of each other and without any prior knowledge or ground truth. Depending on the number of sensors and size of the training set, the amount of computational power required to train the model may be prohibitively large for the edge node. To alleviate such concerns, a base model should be generated from synthetic data. Transfer learning with domain adaptation can then be used to develop a node-specific model. ( Citation: Weber, Doblander & al., 2020 Weber, M., Doblander, C. & Mandl, P. (2020). Towards the Detection of Building Occupancy with Synthetic Environmental Data. https://doi.org/10.48550/ARXIV.2010.04209 ) demonstrated the effectiveness of transfer learning by reducing the amount of training set required by half to achieve similar accuracy in half for occupancy detection, compared to the non-transferred model.
Other#
- Train the model on pre-pandemic data: As discussed before, the shift towards permanent work from home arrangements significantly affected occupancy levels of commercial buildings. A model trained prior to 2020 would be beneficial in tracking anomalies during and shortly after the pandemic, where working from the office was still considered the norm.
- Improvements to data interpolation: Each sensor records observations at slightly different times, leaving gaps in between. Our current approach to fill the gaps is to copy the value of the last reading. However, this may not be optimal, especially during extended outages where the sensors are offline. Several papers such as ( Citation: Nascimento, Oening & al., 2012 Nascimento, R., Oening, A., Marcilio, D., Aoki, A., Paula Rocha, E. & Schiochet, J. (2012). Outliers’ detection and filling algorithms for smart metering centers. IEEE. https://doi.org/10.1109/TDC.2012.6281659 ) proposed ways to effectively fill gaps in observations.
Acknowledgements#
Special thanks to:
- Chehara Pathmabandu, Mahathir Almashor and the DSS team for project supervision and guidance
- John McCulloch for the guide to use DCH and Senaps, as well as providing a Python interface to communicate with its API
- Edric Matwiejew and the Pawsey Summer Internship team for support and mentoring
- The PyOD project for providing implementations to numerous anomaly detection algorithms
This work was supported by resources provided by the Pawsey Supercomputing Centre with funding from the Australian Government and the Government of Western Australia.
Website theme is Paige by Will Faught. Splash photo by Andres Urena.
References#
- Xu, Ren, Zhang & Zhang (2018)
- Xu, C., Ren, J., Zhang, D. & Zhang, Y. (2018). Distilling at the Edge: A Local Differential Privacy Obfuscation Framework for IoT Data Analytics. IEEE Communications Magazine, 56(8). 20–25. https://doi.org/10.1109/MCOM.2018.1701080
- Worner, Bomhard, Roschlin & Wortmann (2014)
- Worner, D., Bomhard, T., Roschlin, M. & Wortmann, F. (2014). Look twice: Uncover hidden information in room climate sensor data. IEEE. https://doi.org/10.1109/IOT.2014.7030110
- Wang, Ren, Xu, Liu, Wang, Zhang & Shen (2019)
- Wang, D., Ren, J., Xu, C., Liu, J., Wang, Z., Zhang, Y. & Shen, X. (2019). PrivStream: Enabling Privacy-Preserving Inferences on IoT Data Stream at the Edge. IEEE. https://doi.org/10.1109/HPCC/SmartCity/DSS.2019.00180
- Zhao, Nasrullah & Li (2019)
- Zhao, Y., Nasrullah, Z. & Li, Z. (2019). PyOD: A Python Toolbox for Scalable Outlier Detection. Journal of Machine Learning Research, 20(96). 1–7. Retrieved from http://jmlr.org/papers/v20/19-011.html
- Morgner, Müller, Ring, Eskofier, Riess, Armknecht & Benenson (2017)
- Morgner, P., Müller, C., Ring, M., Eskofier, B., Riess, C., Armknecht, F. & Benenson, Z. (2017). Privacy Implications of Room Climate Data. InFoley, S., Gollmann, D. & Snekkenes, E. (Eds.), Computer Security – ESORICS 2017. (pp. 324–343).Springer International Publishing. Retrieved from https://link.springer.com/10.1007/978-3-319-66399-9_18
- Husnoo, Anwar, Chakrabortty, Doss & Ryan (2021)
- Husnoo, M., Anwar, A., Chakrabortty, R., Doss, R. & Ryan, M. (2021). Differential Privacy for IoT-Enabled Critical Infrastructure: A Comprehensive Survey. IEEE Access, 9. 153276–153304. https://doi.org/10.1109/ACCESS.2021.3124309
- Weber, Doblander & Mandl (2020)
- Weber, M., Doblander, C. & Mandl, P. (2020). Towards the Detection of Building Occupancy with Synthetic Environmental Data. https://doi.org/10.48550/ARXIV.2010.04209
- Tawalbeh, Muheidat, Tawalbeh & Quwaider (2020)
- Tawalbeh, L., Muheidat, F., Tawalbeh, M. & Quwaider, M. (2020). IoT Privacy and Security: Challenges and Solutions. Applied Sciences, 10(12). 4102. https://doi.org/10.3390/app10124102
- Schmidl, Wenig & Papenbrock (2022)
- Schmidl, S., Wenig, P. & Papenbrock, T. (2022). Anomaly detection in time series: a comprehensive evaluation. Proceedings of the VLDB Endowment, 15(9). 1779–1797. https://doi.org/10.14778/3538598.3538602
- Bali, Al-Osta & Abdelouahed (2017)
- Bali, A., Al-Osta, M. & Abdelouahed, G. (2017). An Ontology-Based Approach for IoT Data Processing Using Semantic Rules. InCsöndes, T., Kovács, G. & Réthy, G. (Eds.), SDL 2017: Model-Driven Engineering for Future Internet. (pp. 61–79).Springer International Publishing. Retrieved from http://link.springer.com/10.1007/978-3-319-68015-6_5
- Zhao, Rossi & Akoglu (2020)
- Zhao, Y., Rossi, R. & Akoglu, L. (2020). Automating Outlier Detection via Meta-Learning. https://doi.org/10.48550/ARXIV.2009.10606
- Markovic, Asif, Corsar, Jacobs, Edwards, Rajarajan & Cottrill (2018)
- Markovic, M., Asif, W., Corsar, D., Jacobs, N., Edwards, P., Rajarajan, M. & Cottrill, C. (2018). Towards automated privacy risk assessments in IoT systems. ACM. https://doi.org/10.1145/3286719.3286723
- Barrero, Bloom & Davis (2021)
- Barrero, J., Bloom, N. & Davis, S. (2021). Why Working from Home Will Stick (w28731). National Bureau of Economic Research : Cambridge, MA. Retrieved from http://www.nber.org/papers/w28731.pdf
- Chen, Machanavajjhala, Hay & Miklau (2017)
- Chen, Y., Machanavajjhala, A., Hay, M. & Miklau, G. (2017). PeGaSus: Data-Adaptive Differentially Private Stream Processing. ACM. https://doi.org/10.1145/3133956.3134102
- Ukil, Bandyopadhyay & Pal (2015)
- Ukil, A., Bandyopadhyay, S. & Pal, A. (2015). Privacy for IoT: Involuntary privacy enablement for smart energy systems. IEEE. https://doi.org/10.1109/ICC.2015.7248377
- Nascimento, Oening, Marcilio, Aoki, Paula Rocha & Schiochet (2012)
- Nascimento, R., Oening, A., Marcilio, D., Aoki, A., Paula Rocha, E. & Schiochet, J. (2012). Outliers’ detection and filling algorithms for smart metering centers. IEEE. https://doi.org/10.1109/TDC.2012.6281659
- Han, Hu, Huang, Jiang & Zhao (2022)
- Han, S., Hu, X., Huang, H., Jiang, M. & Zhao, Y. (2022). ADBench: Anomaly Detection Benchmark. https://doi.org/10.48550/ARXIV.2206.09426