Secondary data

The primary data has many limitations and issues, namely the limited sample size and coverage. Therefore to test whether the hypothesis is proven a secondary data is needed. All of the data came from either the US or the UK and made between 2013 and 2017. I collected 8 different sources of secondary data from the internet about mobile phone demographics, ranging from premade charts to news articles. Out of the 8 sources, 7 of them stated that iPhones are used more by men and women.
Examples of secondary data saying that iPhones are used more by men:
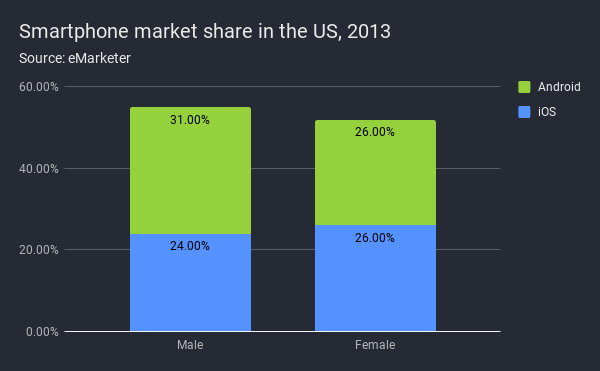
- A news report by eMarketer in 2013 reported that male and younger users favour Android over iOS, with 26% of women using iPhones, compared to 24% for men. The news article used a survey from the Pew Internet & American Life Project.
-
Forbes ran an article where the author analysed a dataset from CivicScience. He noted that people who preferred Android were 56% male and 44% female, which indicates a strong factor in gender. The author also noted that people who used Android devices are “more hard-core techies” and are “more comfortable with the more open but less polished Android user experience”. This matches one of the stated reasons of why people chose Android, which is customisability.
-
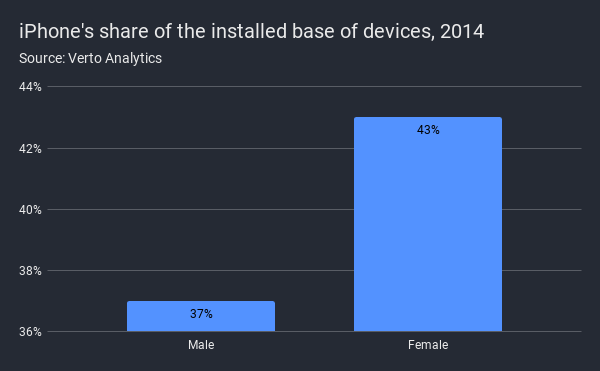
Verto Analytics also reported that the install base of iPhones is larger among female users. It also stated that women chose iPhones because of its design and user experience. Meanwhile, men valued more variety and functions that Android offers.
Other news sources that reported higher iPhone usage among female are…
- The Telegraph (which uses data from GlobalWebIndex),
- CNET, which cited a research sponsored by KS Mobile,
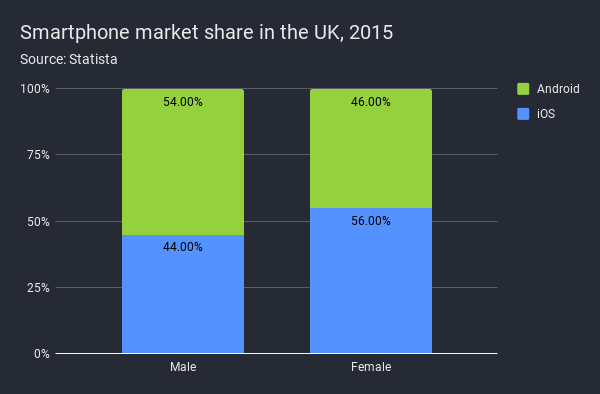
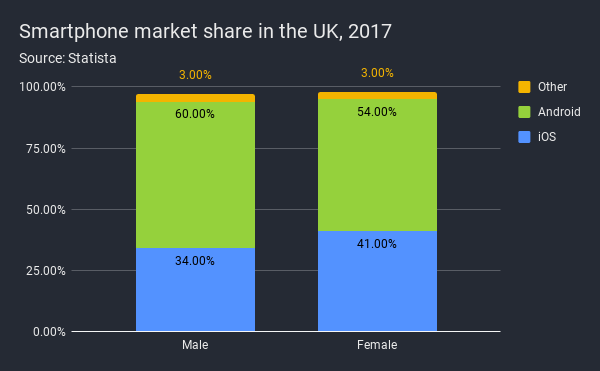
- and statistics website Statista, which collects data from the UK across different years.
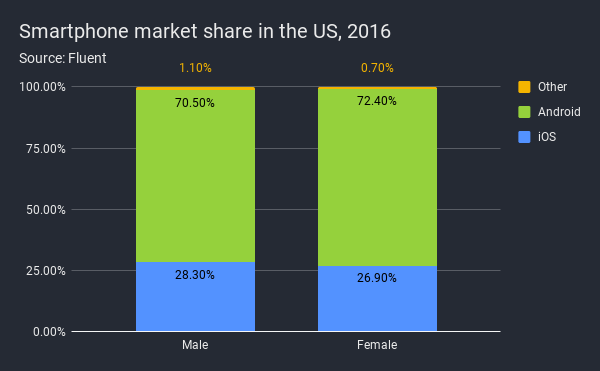
While there are multiple sources that reported higher iPhone usage among females, this is not the case with all sources. This is shown in a market research by Fluent in 2016, which shows that 26% of female respondents are an iOS user, slightly less 28.3% of males that uses iOS.
Secondary data conclusion
From these findings, it is clear that in most cases women generally prefers iOS devices while men tend to prefer Android devices, which matches with my hypothesis and my primary data, and I am fairly confident that the data that said otherwise is an outlier.
To see the references fot the secondary data, see credits and references page.