Conclusion

In order to support my conclusion, I used data that is authoritative, relevant and timely. Here is an explanation to the points above:
- Authoritative data is data that has been sourced from an authentic and trustworthy sources, to ensure that the information generated ius not false of misleading.
- A relevant data is data that is related to the research topic. FOr example, since I am investigating about phone market share, I wouldn’t use a data about the number of dogs, since they have nothing to do to my research topic.
- A Timely data is data that is relevant to the time span that is being studied. For my case, I aim to source data from a maximum age of 5 years old, since the mobile phone world is changing rapidly.
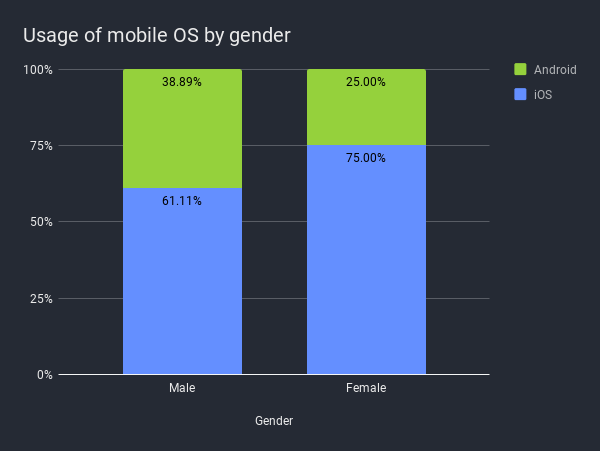
The primary data ticks all of the points above, as I am the one who collected the data and it is conducted only a few months prior to making this site.
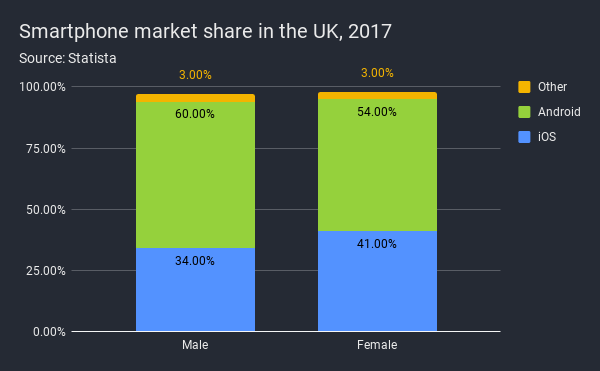
All of the secondary data used either came from websites such as Statista, Market research organisations such as Verto, or news sites. I consider secondary sources from Statista,Verto or Pew Research to be highly authoritative as they collected the data by themselves, and the quality of the data is likely to be accurate.
Here is a chart from one of the statistics organisation.
Here is an example of a chart from a news site, which sourced their data from Pew Research, a major research organisation.
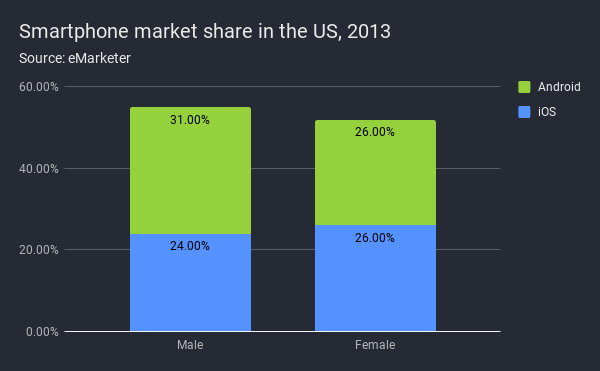
From the charts above, as well as almost all of the other sources that is found in the findings page, it is clear that both the primary data and the secondary data shows that there is a clear difference in mobile phone usage share across males and females.
In conclusion, my hypothesis that females are more likely to use iPhones has been proven to be true.
Limitations
While I concluded that there is a difference in mobile phone usage share across genders, there are many variables and limitations associated with this research. If I have been given more time and have better secondary datasets, the results might have been different.
What next?
If you managed to get this far, congratulations!
Don’t forget to look at the references and/or submit your feedback